Mastering Market Movement: Why Price Action, Volume & Open Interest Are the Three Pillars of Profitable Trading
Mastering Market Movement: Why Price Action, Volume & Open Interest Are the Three Pillars of Profitable Trading
Trading professionals widely regard price, volume, and open interest as the foundational triad for market analysis. Legendary technician John J. Murphy defines technical analysis as the study of “market action,” which “refers to price, volume, and open interest data.” In other words, these three metrics encapsulate the core information a trader uses to read the market. Modern analysts echo this principle – for example, an Investopedia guide notes that “many traders combine price action, volume, and open interest to create bullish or bearish market signals.”
This trifecta is seen as essential for understanding market strength: price action shows what direction the market is moving, volume reveals the intensity or enthusiasm behind those moves, and open interest (the number of active contracts) gauges the depth of participation. As one futures brokerage put it, understanding this “trifecta” of price, volume, and open interest is critical to successful market analysis. Together, these three pillars form the bedrock of trading decisions in futures and options, helping traders confirm trends and anticipate reversals with greater confidence.
Anchored VWAP (aVWAP) – Volume-Weighted Price by Key Events
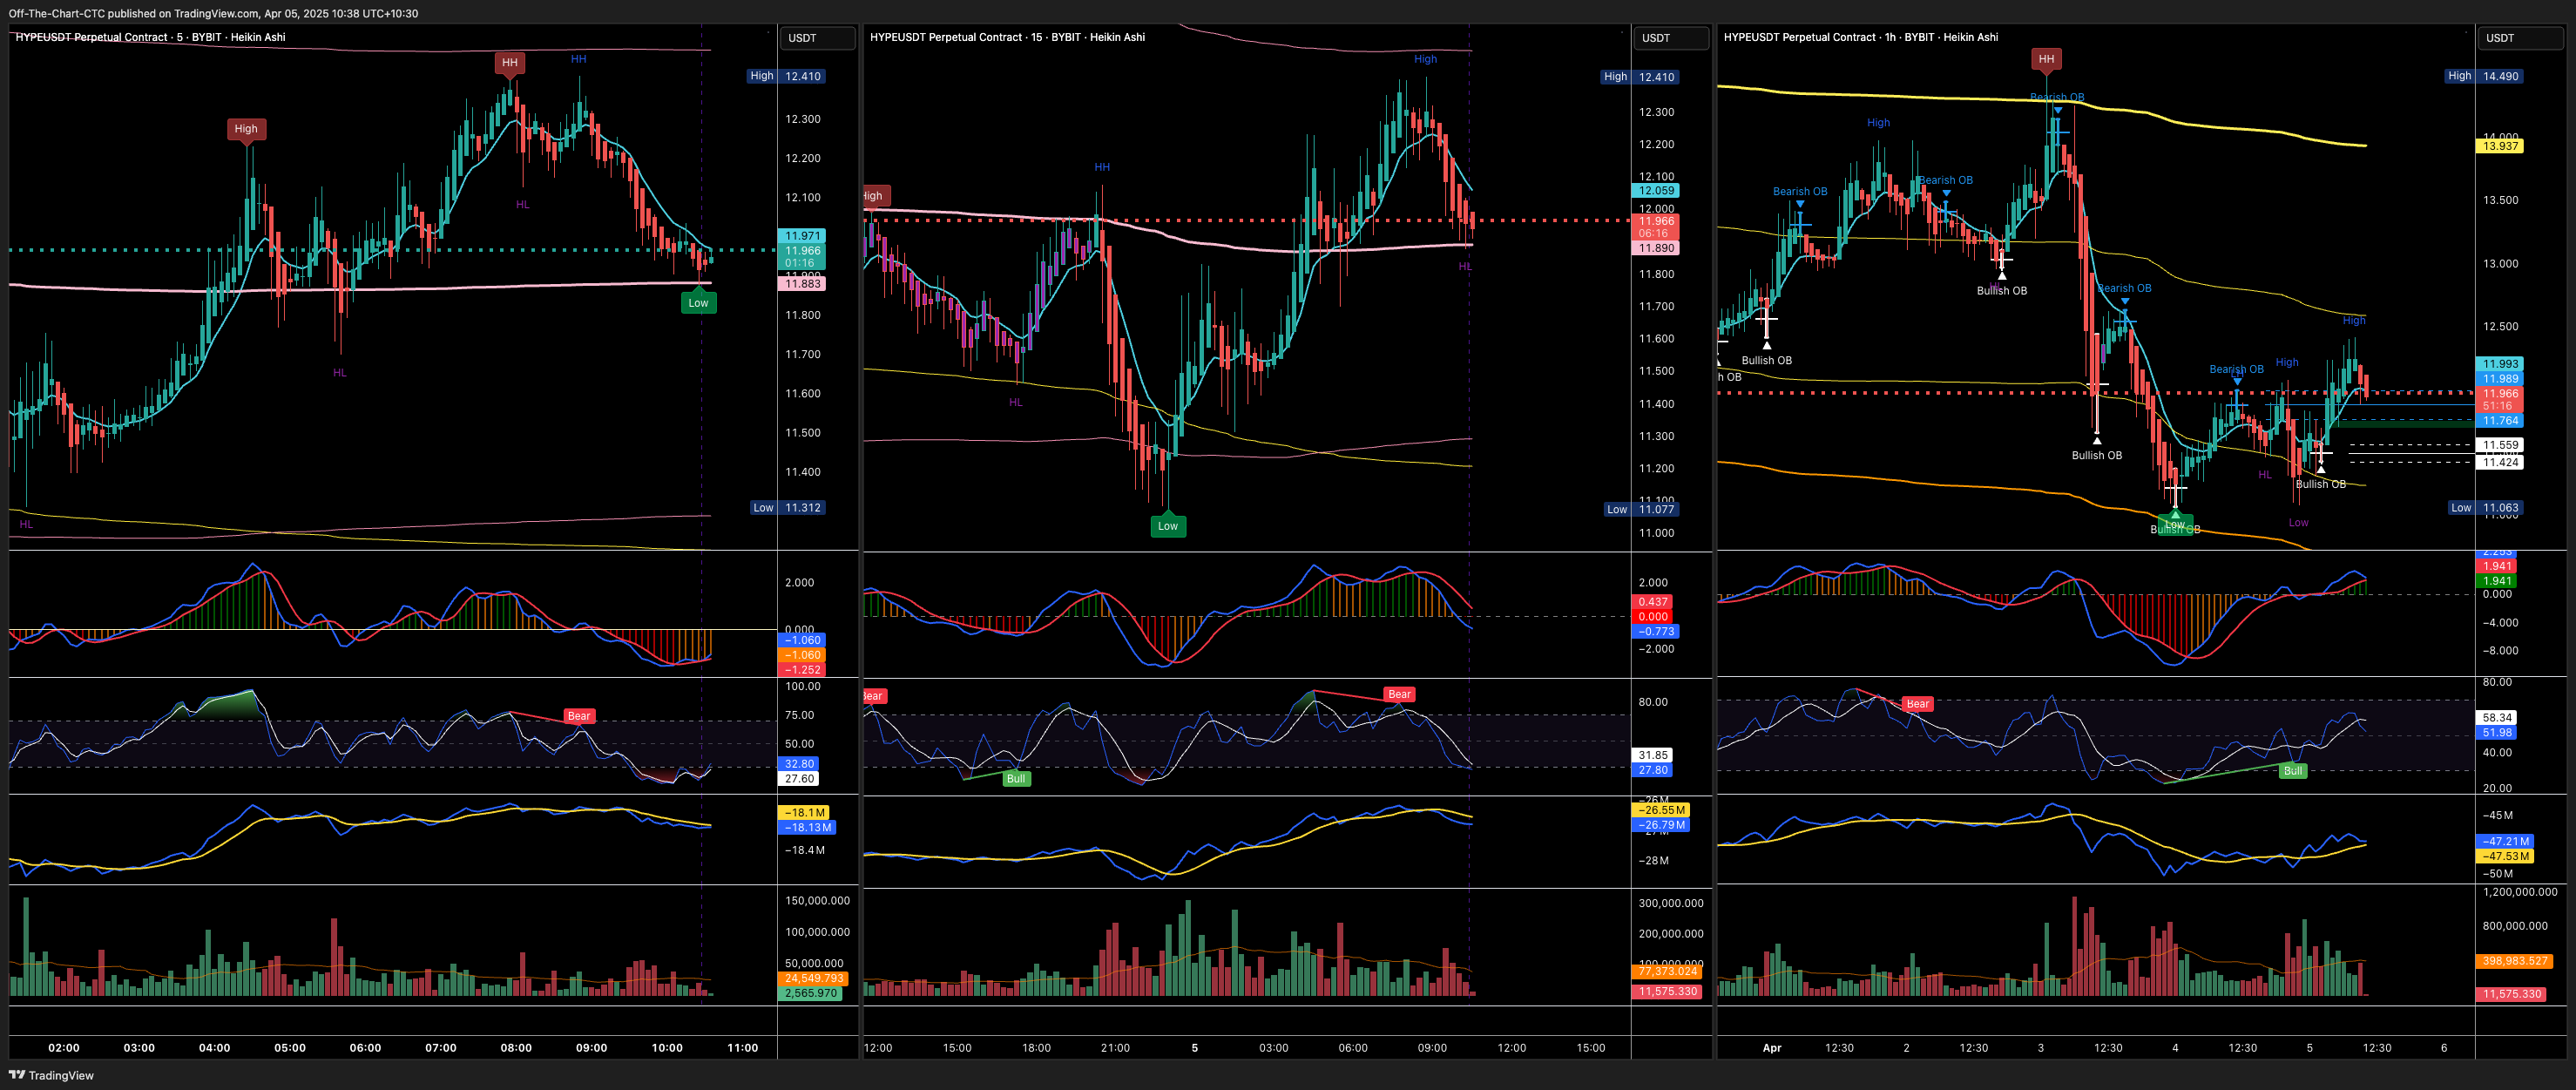
You can see where price bounces of aVWAP’s
The Anchored VWAP (Anchored Volume-Weighted Average Price) has emerged as a vital technical tool for many traders. It extends the concept of VWAP – which itself is heavily used by institutions to measure average price paid without overly moving the market, by allowing the calculation to start from any significant point in time (an “anchor”). Unlike a standard VWAP that resets each day, an anchored VWAP lets traders select a specific high, low, or event date as the start, then computes the average price from that point forward, weighted by volume. This provides valuable context about who is in control since that event (buyers or sellers).
According to Brian Shannon (the CMT who popularised this indicator), markets often exhibit an “anchoring” bias after significant news or turning points, and anchoring the VWAP to such events helps traders adjust their strategy to the new market context. In practice, the anchored VWAP is used to confirm trend direction and identify key support or resistance levels. StockCharts’ ChartSchool notes that, just like the traditional VWAP, an anchored VWAP “can confirm trends and identify areas of support and resistance on the price chart.”
By zeroing in on a particular timeframe or catalyst, aVWAP filters out prior price action that isn’t relevant to the current trend, essentially highlighting the average price where most volume has traded since the chosen event. Traders and even institutional players now monitor anchored VWAP levels to gauge value areas; as one trading resource mentions, “VWAP and Anchored VWAPs are commonly used by institutions” handling large volumes. In summary, aVWAP has proven to be an effective instrument for timing entries/exits – it marries price with volume over custom periods, helping to ensure one’s trades align with where significant money has actually flowed in the market since a pivotal moment. This ability to tie price to an objective, volume-weighted benchmark from any point in time is why many experts consider anchored VWAP an essential tool in today’s trading arsenal.
Fibonacci Retracement Levels – Anticipating Support and Resistance
Fibonacci retracement levels are another cornerstone tool in technical trading, valued for their uncanny ability to forecast potential support and resistance zones. Based on the famous Fibonacci sequence and its key ratios (23.6%, 38.2%, 50%, 61.8%, etc.), these levels are drawn by taking a major price high and low and marking where price might pull back. Traders across markets – stocks, forex, futures, crypto – heavily use Fibonacci retracements because they often highlight price levels where trends pause or reverse.
In fact, Fibonacci retracements are so popular that they’re considered a standard part of many trading strategies. As Investopedia explains, “Fibonacci retracements are popular tools that traders can use to draw support lines, identify resistance levels, place stop-loss orders, and set target prices.” Once plotted, the horizontal Fib lines help map the geometry of a trend, identifying areas where buying or selling interest is likely to emerge. Market experience has shown that price reversals tend to occur near these Fib ratios with surprising frequency.
One analysis notes that Fibonacci levels “often indicate reversal points with uncanny accuracy.” This means that a stock pulling back in a rally might find a floor around the 38.2% or 50% retracement, for example, before resuming its uptrend – a pattern seen time and again by technical traders. Of course, Fibonacci levels are not magic; they work best in conjunction with other signals (candlestick patterns, trendlines, volume confirmations, etc.). But the significance of these levels is well-recognized in trading literature and practice.
Even legendary methods like Dow Theory and W.D. Gann’s techniques acknowledged the importance of 50% retracements, underscoring that the concept of proportional pullbacks is deeply rooted in market psychology. In summary, Fibonacci retracement tools have earned their place as essential trading instruments by helping traders systematically anticipate where a trending market might find support or resistance, allowing for better-timed entries, exits, and risk management.
On-Balance Volume (OBV) – Volume Momentum Leading Price
Developed by Joseph Granville in 1963, On-Balance Volume (OBV) is one of the classic volume indicators that remains widely used due to its proven ability to gauge buying and selling pressure. OBV works by keeping a running cumulative total of volume – adding volume on up days and subtracting volume on down days – to reveal the net flow of volume into a security. Granville’s central insight was that volume often leads price. He believed volume is the “key force” driving markets and designed OBV to anticipate major price moves based on volume trends. In his book, Granville vividly described OBV’s predictive build-up as “a spring being wound tightly” – implying that when volume surges without a corresponding price move, pressure is mounting for an eventual breakout.
This perspective highlights OBV’s role as a leading indicator of potential trend changes. Modern analysts continue to rely on OBV for a read on “crowd sentiment” in the market. Investopedia defines OBV as “a technical trading momentum indicator that uses volume flow to predict changes in stock price.” The logic is straightforward: if OBV is rising (more volume on up moves than down moves), it suggests accumulation – buyers are quietly building positions, which is bullish. If OBV is falling, it signals distribution or selling pressure ahead of price.
Notably, OBV often diverges from price at key turning points; for example, OBV may start declining while price is still rising, warning that the rally is losing internal support. Analysts note that OBV effectively “shows crowd sentiment that can predict a bullish or bearish outcome.” In practice, traders use OBV to confirm price trends (a rising price with rising OBV is healthier than one with flat OBV) and to spot divergences where OBV and price move in opposite directions as a heads-up for reversals.
Because of its simplicity and clear premise, OBV is taught in nearly every technical analysis course and is employed by traders from retail to institutional. It distills the often complex picture of volume into a single cumulative line that is easy to compare with price. The enduring use of OBV over decades – and the fact that it frequently tips off trend changes before price does – serves as expert validation of its significance as an essential trading tool for measuring volume momentum.
Open Interest Indicators – Reading Market Participation and Trend Strength
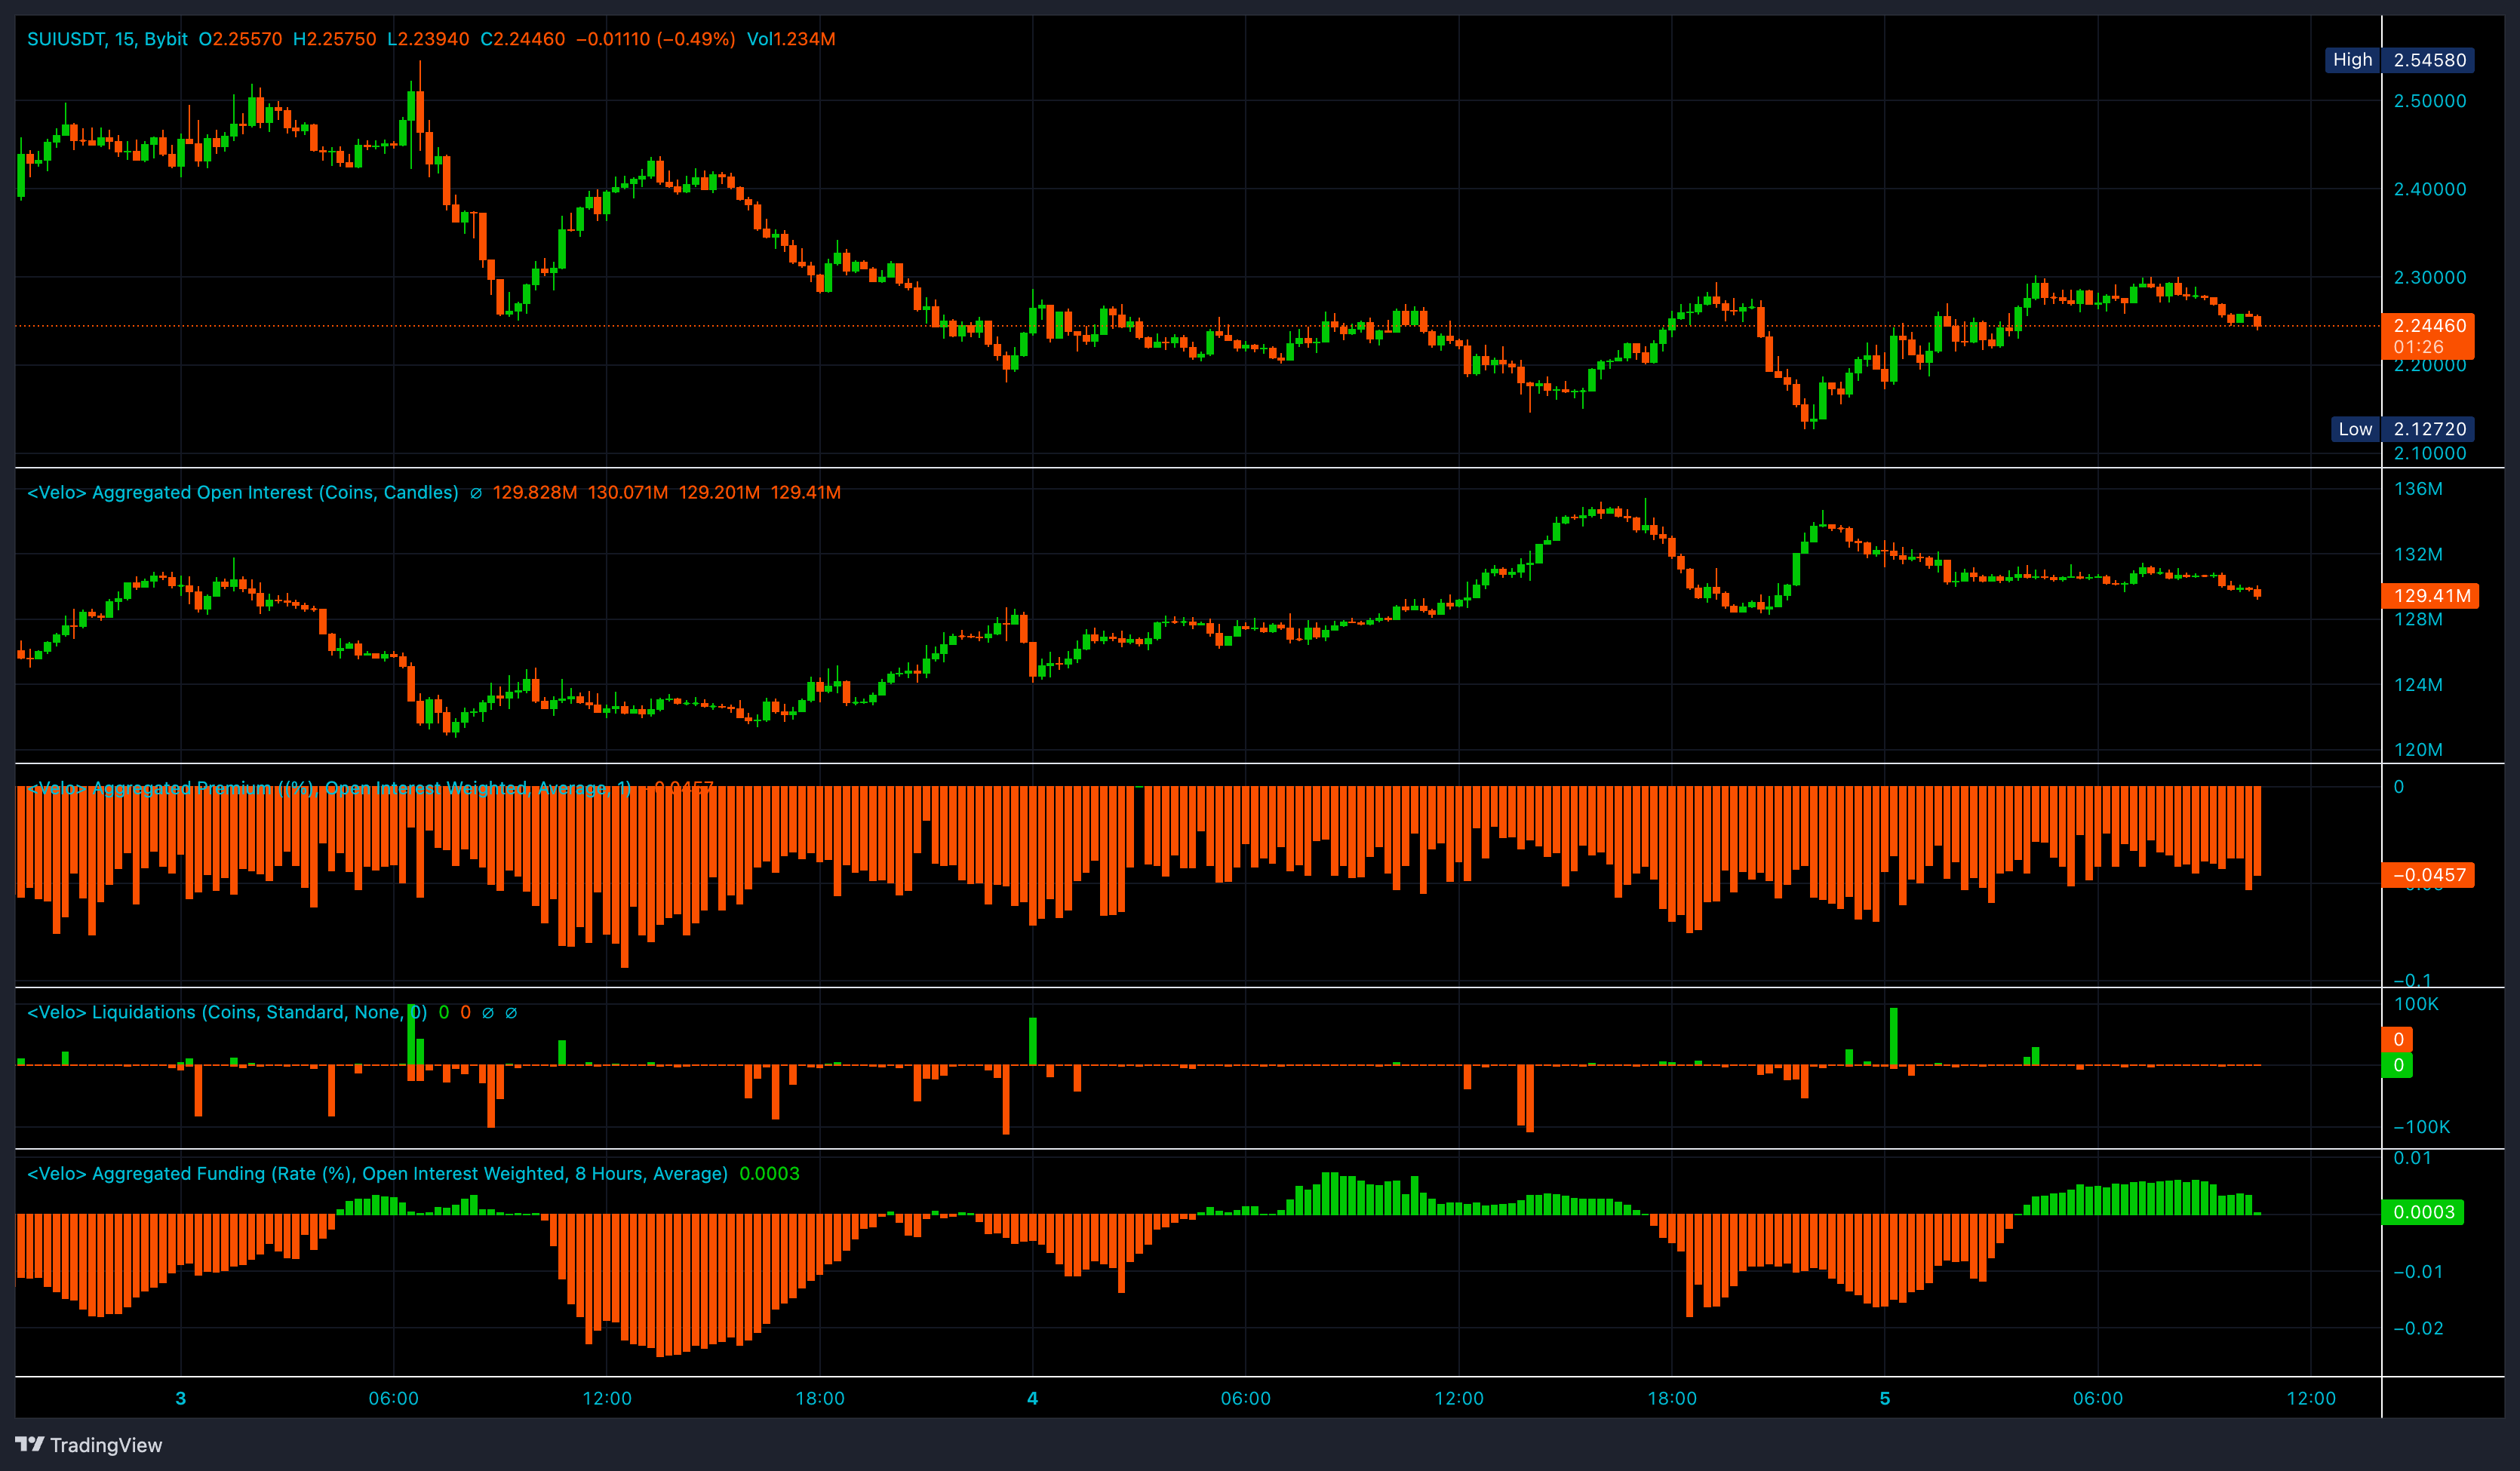
In futures and options markets, open interest (OI) is a critical metric that traders watch to assess the strength of market trends and the commitment of market participants. Open interest represents the number of outstanding contracts (long or short) that remain open – in other words, it measures how much money “is coming into or leaving” the market. A rise or fall in OI can reveal whether a price move is fueled by new capital or merely by traders closing positions.
Expert sources emphasise that OI, when analysed alongside price and volume, yields powerful insights: “Volume represents a measure of intensity or pressure behind a price trend, [while] open interest measures money flow into or out of the market.” Traders often use open interest to confirm trends or signal reversals. Classic trading rules tie the three pillars (price, volume, OI) together to interpret market health:
Price rising + volume rising + open interest rising – Indicates new money entering on the buy side. This expansion in OI confirms a strong uptrend (bullish continuation) .
Price rising + volume falling + open interest falling – Indicates a rally driven by traders closing shorts (short-covering) rather than fresh buying. OI contraction shows money leaving the market, a bearish warning sign that the up-move may be unsustainable .
Price falling + volume rising + open interest rising – Indicates new money coming in on the sell side (new shorts). The increasing OI confirms a strong downtrend (bearish continuation) as more participants bet on decline .
Price falling + volume falling + open interest falling – Indicates a decline driven by long holders liquidating positions. The shrinking OI means money is exiting the market; this capitulation often precedes the end of a downtrend (a potential bullish reversal) once the selling pressure is exhausted .
In practice, traders find open interest especially useful for gauging the conviction behind price moves. For example, a breakout to new highs on high volume is more convincing if open interest also jumps – signaling fresh buyers are piling in to support the move. Conversely, if that breakout happens while OI drops, savvy traders suspect it’s mainly existing players covering positions, which can make the rally short-lived.
Open interest data is so important in futures trading that exchanges and data providers offer specialised open interest tools – such as heatmaps and OI charts – to track how OI changes by strike price or trading day. These tools help traders spot where big positions are building up. High open interest in certain options strikes, for instance, might indicate influential support/resistance levels due to hedging activity.
More generally, high open interest implies a liquid and active market that large traders are involved in, which tends to make trends more robust (and reversals more dramatic when they do occur). As a CME Group educational note succinctly puts it, “when open interest increases, it suggests that new money is flowing into the market, indicating strong or emerging trends”. On the other hand, dwindling open interest can be a sign of trend fatigue. In summary, open interest serves as an essential barometer of market participation and sentiment.
Trading veterans routinely incorporate OI analysis into their strategy – confirming trend strength, identifying divergence (price moving without OI support), and timing trend reversals – which is why open interest and related tools are counted among the must-watch indicators for serious futures and options traders .
Sources: John J. Murphy’s Technical Analysis of the Financial Markets (via StockCharts) ; Investopedia – Technical Analysis: Open Interest and Volume ; Optimus Futures Blog ; StockCharts ChartSchool ; Investopedia – VWAP ; TrendSpider (Brian Shannon on AVWAP) ; Investopedia – Fibonacci Retracements ; Investopedia – On-Balance Volume (OBV) ; StoneX Futures Education .
Related Posts
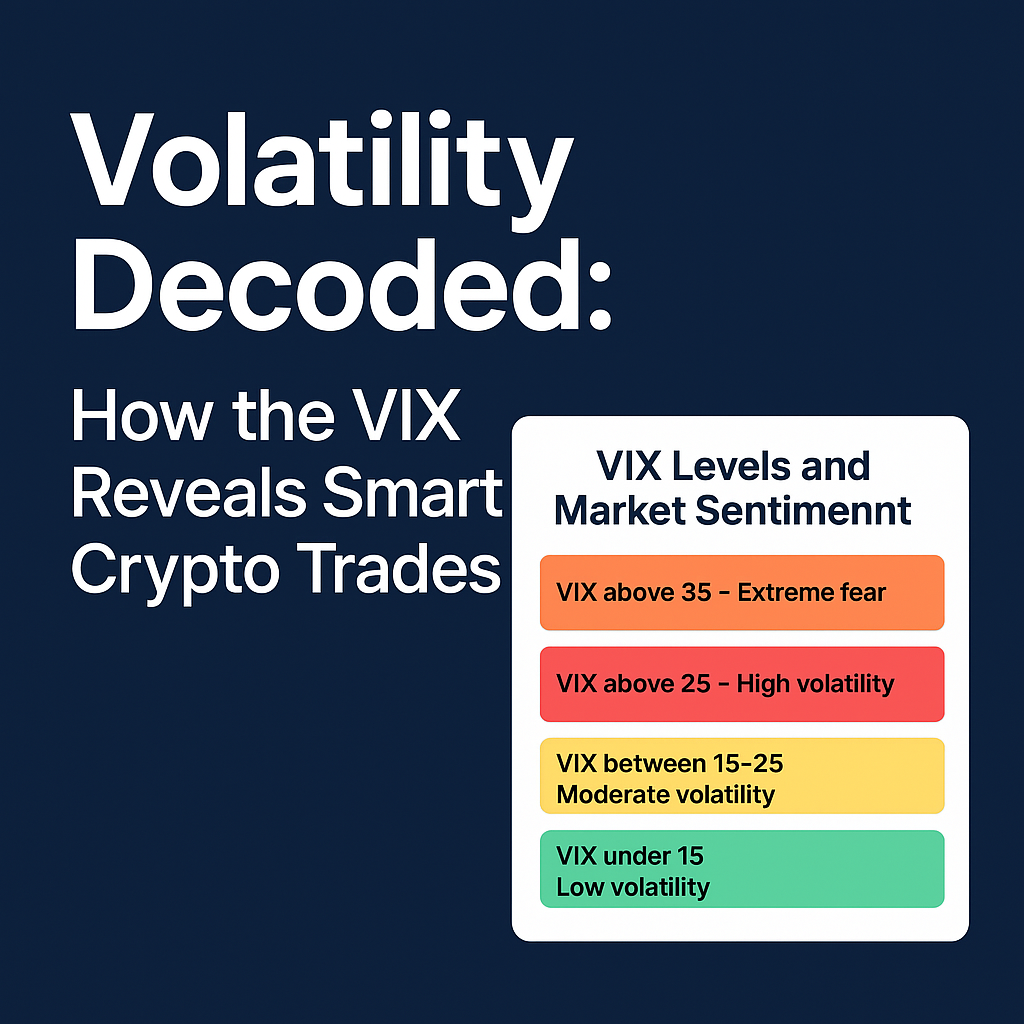
Fear Isn’t the Enemy — It’s the Signal: Trading the VIX with Price, Volume & OI

Mastering Fair Value Gaps: The Key to Spotting Market Imbalances and Boosting Your Trading Strategy

2025 Crypto Trading Playbook: Insights and Strategies for Winning Big
Mastering Key Indicators: Six Indicators Every Trader Should Know
© Copyright Off The Chart 2025
Powered by Off The Chart