Mastering Fair Value Gaps: The Key to Spotting Market Imbalances and Boosting Your Trading Strategy
Mastering Fair Value Gaps: The Key to Spotting Market Imbalances and Boosting Your Trading Strategy
Have you ever wondered why prices suddenly reverse or shoot through key levels, leaving traders scrambling? The answer lies in understanding the market's hidden footprints: Fair Value Gaps. In this blog, we will break down fair value gaps and show real examples of their use in trading.
“The market is an ever-changing mechanism, and its inefficiencies are your opportunities.”
Paul Tudor Jones (Billionaire Hedge Fund Manager and Founder of Tudor Investment Corporation)
What is ‘Fair Value’ in the Market?
Let’s start with the basic concept of fair value. Fair value in the market is the theoretical price at which an asset should trade, reflecting a balance between supply and demand under normal conditions. It represents an asset's “true” or “intrinsic” value based on its fundamental and market factors.
Key Aspects of Fair Value:
1. Equilibrium Price:
• Fair value is where buyers and sellers agree on the price, and no significant pressure exists to push the price up or down.
2. Fundamental Drivers:
• Factors like earnings (for stocks), interest rates, macroeconomic conditions, or supply and demand influence fair value.
• For example, fair value might consider network adoption, transaction volume, and market sentiment in crypto.
3. Market Context:
• Fair value changes dynamically with new information, such as economic reports, earnings releases, or geopolitical events.
4. Temporary Deviations:
• Prices often deviate from fair value due to market inefficiencies, speculation, or emotional trading (fear and greed). These deviations create opportunities for traders to profit as the market corrects itself.
Fair Value in Different Contexts:
1. In Trading:
• Traders use fair value to identify price imbalances.
• For example, if an asset trades below its perceived fair value, it might be considered undervalued, presenting a buying opportunity.
2. In Derivatives:
• In futures markets, fair value accounts for the spot price, interest rates, and dividends (if applicable) to determine the appropriate price of a futures contract.
3. In Fair Value Gaps (FVG):
• FVGs occur when price moves rapidly, leaving an imbalance between buyers and sellers. These gaps represent areas where the market temporarily diverged from fair value and may return to “rebalance.”
“The trend is your friend until the end when it bends.”
Ed Seykota
Ed Seykota is a trend-following trader and systems developer, often considered a pioneer of algorithmic trading. His trading philosophy emphasises simplicity, discipline, and understanding market trends.
Fair Value in Crypto Markets:
In cryptocurrency trading, fair value is harder to determine due to the speculative nature of the market. Factors influencing fair value in crypto include:
• Network Utility: The usability and adoption of the blockchain or token.
• Market Sentiment: Emotions play a larger role, leading to significant price deviations from fair value.
• Liquidity and Volume: Low liquidity can cause price to deviate significantly from fair value.
• Fundamentals: Metrics like active addresses, transaction volume, or staking yields.
How Traders Use Fair Value:
1. Identify Overbought/Oversold Conditions:
• Compare current price to fair value estimates to spot extremes. Another fantastic tool I use is the Volume-Weighted Average Price (VWAP) that I set up on my exchange charts before I commit to a trade. Am I getting a bargain, or am I paying a premium? In its most simple form:
• RSI Overbought → Price > Fair value → Possible short.
• RSI Oversold → Price < Fair value → Possible long.
2. Exploit Inefficiencies:
• Fair value helps traders find inefficiencies caused by FVGs or gaps.
3. Support and Resistance Zones:
• Fair value zones often align with key support and resistance levels, making them actionable trading points.
4. Volume and Order Flow Analysis:
• Volume and order flow can help identify where the market sees fair value at any given moment. I use On Balance Volume (OBV) to help identify a reversal to a FVG.
IMAGE
How Do You Calculate a Fair Value Gap (FVG)
These days, we have indicators that do all the work for us, but you should never use an indicator unless you understand what it’s telling you and why! So, let’s examine how we calculate an FVG further.
A Fair Value Gap (FVG) is calculated by identifying a specific price imbalance in a candlestick chart, typically during strong market moves. This gap reflects a zone where not all buy or sell orders were matched, leaving an inefficiency in the market.
Steps to Calculate a Fair Value Gap
1. Identify the Impulse Candle:
• Look for a large candlestick (often called an impulse candle) where the price moves significantly in one direction. These candles often represent institutional or high-volume trades.
2. Focus on Consecutive Candles:
• FVGs are calculated using three consecutive candles on the chart:
• Candle 1 (Before the Move): The starting point before the strong price move.
• Candle 2 (Impulse Candle): The large candle creates the imbalance.
• Candle 3 (After the Move): The candle attempting to rebalance the price.
3. Determine the Gap:
• For a bullish FVG:
• Identify the low of Candle 3 and the high of Candle 1.
• If the low of Candle 3 is above the high of Candle 1, the space between them forms the FVG.
• For a bearish FVG:
• Identify the high of Candle 3 and the low of Candle 1.
• If the high of Candle 3 is below the low of Candle 1, the space between them forms the FVG.
4. Mark the Gap on the Chart:
• Draw a box between the high of Candle 1 and the low of Candle 3 (for bullish FVG) or the low of Candle 1 and the high of Candle 3 (for bearish FVG).
Key Characteristics of FVGs:
• Timeframe Matters: FVGs are more significant on higher timeframes (e.g., daily, 4-hour) than lower ones.
• Partial Fills: The market often revisits these gaps to “fill” them partially or fully, signalling potential retracement or continuation zones. I mostly use them as support and resistance, so I start setting my limit orders at the ‘touch’ and may also place some to DCA through the FVG (normally when the FVG is very large)
• Volume Confirmation: High volume during the impulse move strengthens the validity of the FVG.
Why Does This Matter?
• Market Psychology:
• FVGs represent zones where aggressive buyers or sellers dominated, creating inefficiencies.
• Market participants often see these zones as opportunities for price to return and “rebalance.” I will use these as opportunities to get the ‘pullback’ instead of feeling FOMO when the market is running (or in freefall).
• Trading Application:
Use FVGs as zones to plan entries and exits/ potential reversal or retracement zones.
Combine with other tools like OBV, Fibonacci retracement, and EMAs to confirm setups.
Look for confluence with support/resistance levels or Fibonacci retracement zones.
3. Real Examples
A good analogy for an FVG is to think of them as like a “Rubber Band Effect” - Think of price movement as a rubber band being stretched. When the price moves rapidly in one direction, leaving a gap, it’s like stretching the rubber band too far. Eventually, it snaps back, revisiting the gap to relieve the tension. FVGs represent areas where the market is “stretched,” and traders anticipate a snap-back to these levels.
Here are some examples of trades I have taken. Even now, I sometimes think I’ve missed the opportunity (FOMO), only for the market to find its equilibrium.
Example 1: Friend Misses a Big Opportunity
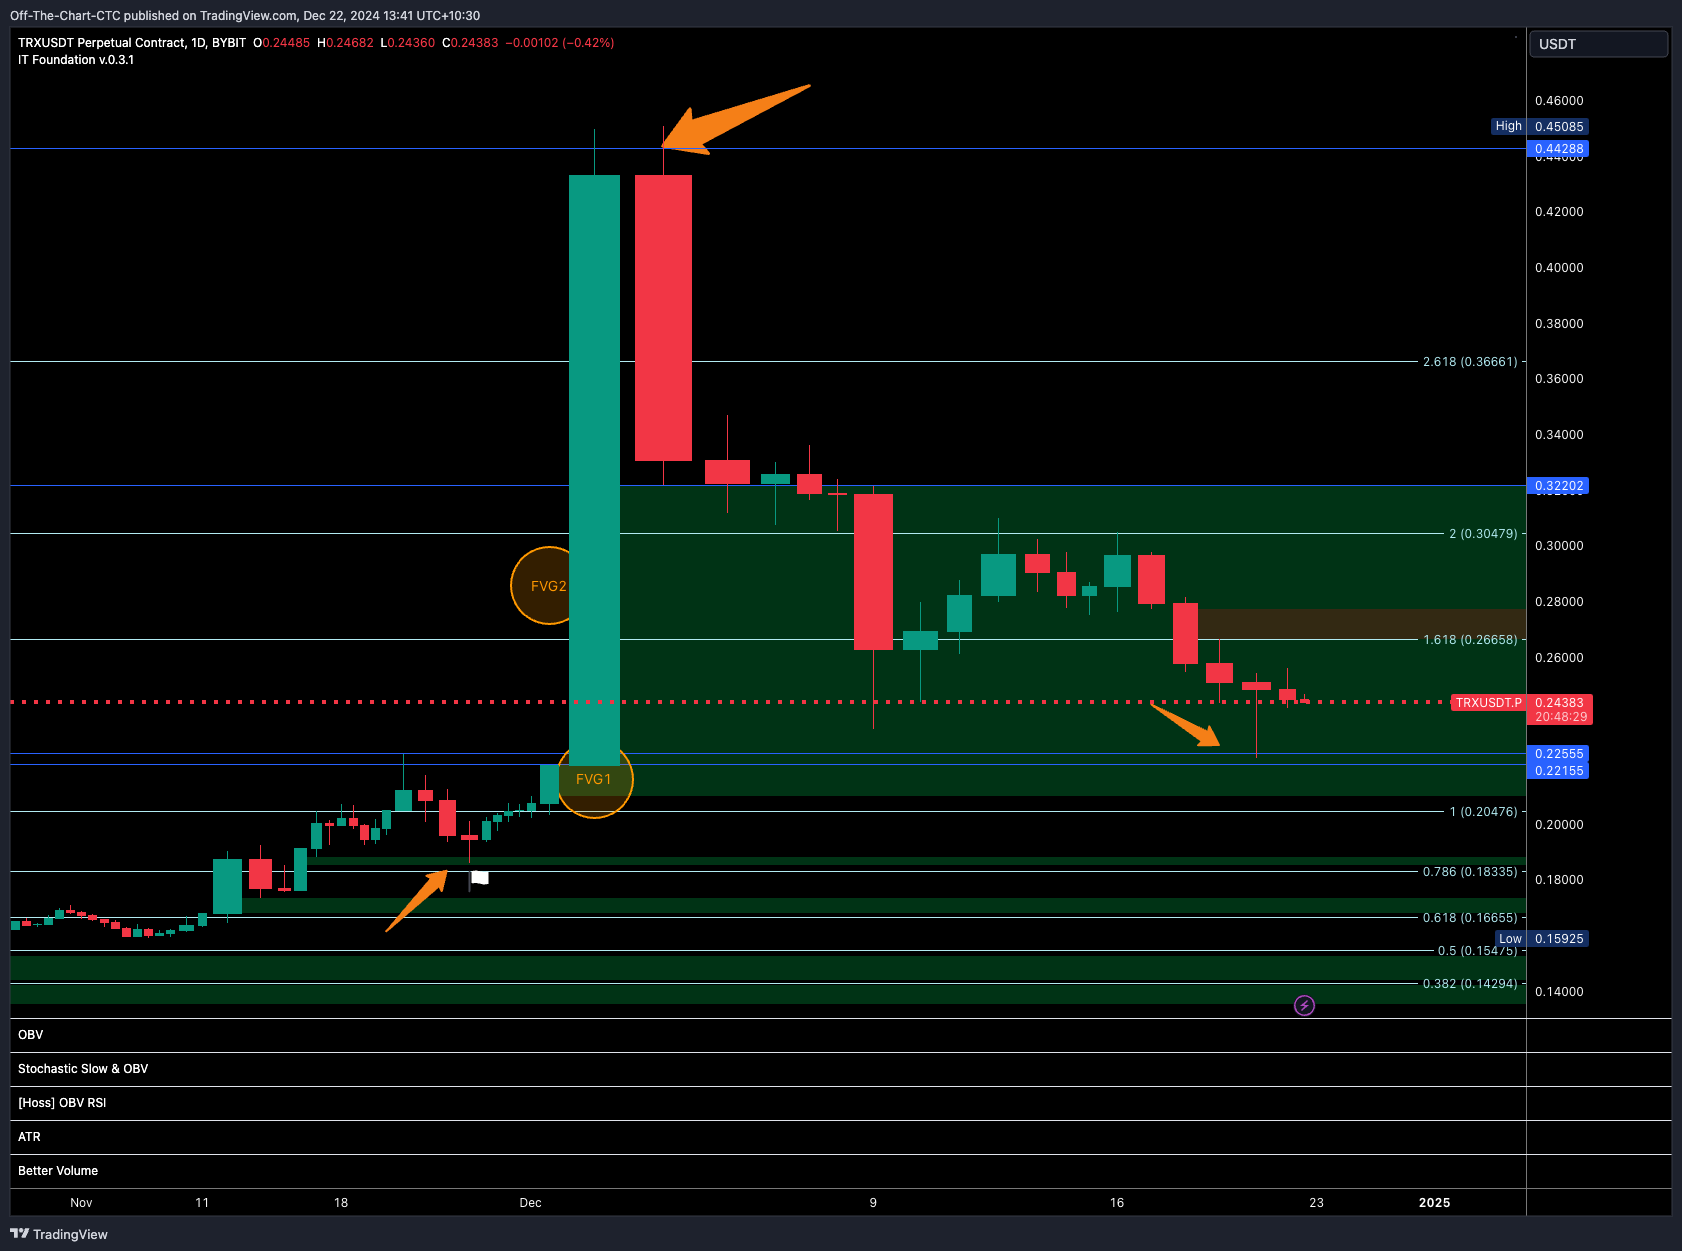
The first was for a friend asking for advice (and ignoring me with a severe case of FOMO). I told a friend not to buy TRX at 0.442c when it had its massive run recently (yes, he’s a newbie to crypto - only interested in buying at the highs!). The chart shows two FVGs - my blue line hides the small gap between them. I went long at 0.189, where the white flag is with a limit buy at a previous FVG.
Okay, as you can see in the chart, my friend called on the green candle day. He wanted in. I told him to be patient; this volume and massive candle will retrace. He said it would keep going and didn’t want to miss out. I begged him to do nothing yet. The next day, he called me to say, “I told you it would keep going up!” and he bought - with all of his savings (about AUD$40k). He got in at 0.4428. Argghhh.
So what would I have suggested to him? Well, my Trading View showed the massive FVG. I would have suggested limit orders at 0.32 (touch of FVG), 0.304 (Fib Level 2), 0.267 (Fib Level 1.618) and in a best-case scenario, 0.22 and 0.21 (Bottom of two FVGs on the chart). He would have achieved 4 of those buys, and at the time of writing this, the 5th is in play. Where does it go from here? No-one knows. I sincerely hope he gets his money back (he bought it on SPOT, even though the example shows my Perpetual chart). He will now have a bearish FVG sitting right on the 1.618 Fib Level to contend with as a resistance level. Ouch. A harsh lesson.
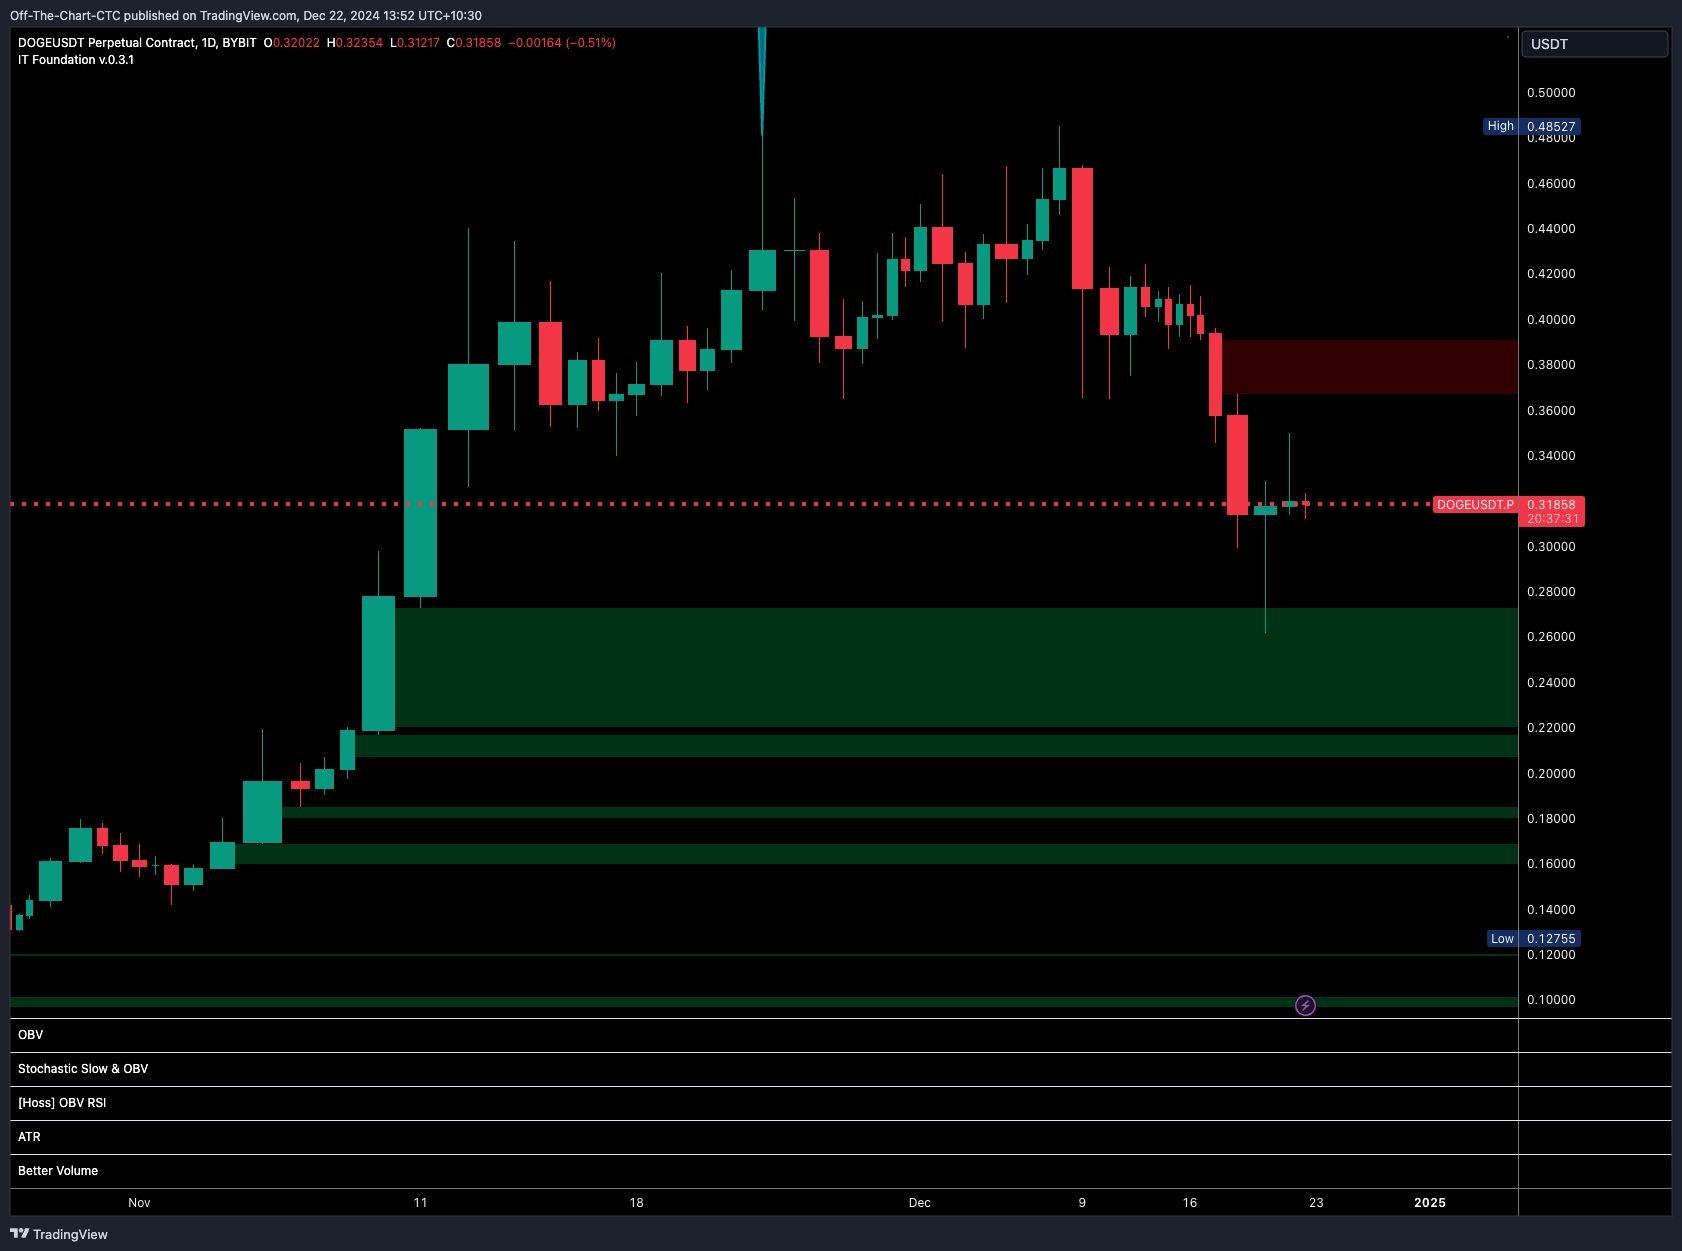
EXAMPLE2: DOGE
The second example is a trade I am currently in. I’d set several limit buys in the top two FVGs on the screen. One has been hit so far, and my first Take Profit is at the bottom of the Bearish FVG that has been set. We may see a continuation once we break through that Bearish FVG, but I will confirm with OBV and Open Interest. We may go down first, and I can DCA my buys.
Conclusion
So do not forget the psychology that sits behind the FVG:
Liquidity and Participation:
• FVGs highlight where institutional players (like banks and funds) might have entered the market aggressively, creating imbalances.
• Retail traders often miss out in these areas, leading the market to revisit them so everyone has a chance to participate.
Fear and Greed:
• Rapid price movements create fear (missed out) or greed (chasing the move), but the market aims to correct these emotions by returning to fill gaps.
Market Efficiency:
• The market seeks balance and fairness, constantly correcting inefficiencies like FVGs to ensure smoother price discovery.
Key Teaching Point:
FVG is like identifying “unfinished business” in the market. It answers where price might go.
“The game does not change and neither does human nature.”
Jesse Livermore: Livermore was a pioneer of price action trading and understanding market psychology. His insights into market behavior and inefficiencies form the foundation for many technical analysis concepts, including areas like FVGs that reflect imbalanced market activity.
Related Posts
Fear Isn’t the Enemy — It’s the Signal: Trading the VIX with Price, Volume & OI
Mastering Market Movement: Why Price Action, Volume & Open Interest Are the Three Pillars of Profitable Trading

2025 Crypto Trading Playbook: Insights and Strategies for Winning Big
Mastering Key Indicators: Six Indicators Every Trader Should Know
© Copyright Off The Chart 2025
Powered by Off The Chart